
Bookmarks are a great way to story tell in Power BI as they can be used to save pre configured states in a report. However they have drawbacks in that you have to create two versions of a button for each bookmark and show/hide one of them depending on the bookmark state. This becomes cumbersome to manage when you have a lot of bookmarks across multiple pages in a report.
An alternate is to use disconnected tables and DAX to drive bookmark button behaviour. The advantage of this option is that you only have one bookmark button for each bookmark and you have to configure its behaviour using DAX. You set up the DAX formulas just once and you can use the same set of bookmarks for other pages in the report.
To get started we open up a Power BI model and create a disconnected table called BookmarkFlag and create a new column called Value with five rows with values – 1, 2, 3, 4, 5
Now we need to create a few DAX measures to store the HEX properties of the colours we are going to use in the bookmark buttons. We will be using different colours for text and fill for the button text and fill. Hence we define four DAX measures as follows:
DefaultHoverTextColour = “#B3B3B3”
DefaultTextColour = “#E6E6E6”
SelectedColour = “#FFFFFF”
SelectedFillColour = “#FF6E15”
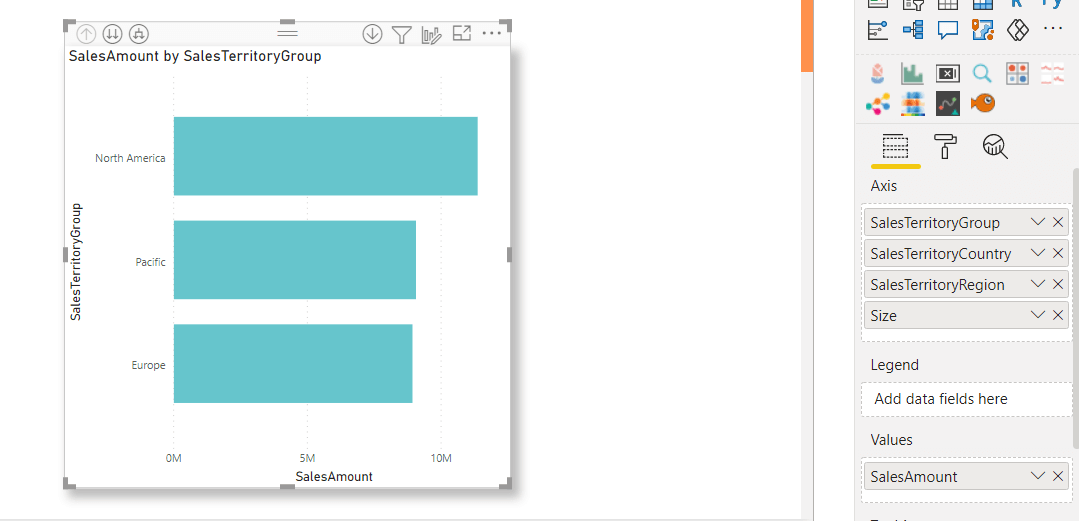
Next we go ahead and create a simple chart as below which shows the sales amount for the four hierarchies – SalesTerritoryGroup, SalesTerritoryCountry, SalesTerritoryRegion, Size
Next we create four bookmark buttons so that each one of them when clicked shows the sales for each hierarchy. They are also named appropriately as below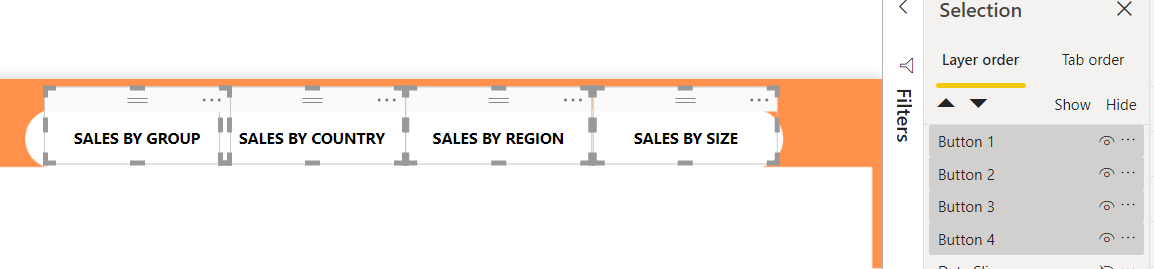
Next we need to define a series of DAX measures to drive the behaviour of the bookmark buttons. We define three measures for the first button as follows
Button 1 Fill Colour =
IF (
SELECTEDVALUE ( ‘BookmarkFlags'[Value] ) = 1,
[SelectedFillColour],
[SelectedColour]
)
Button 1 Hover Text Colour =
IF (
SELECTEDVALUE ( ‘BookmarkFlags'[Value] ) = 1,
[SelectedColour],
[DefaultHoverTextColour]
)
Button 1 Text Colour =
IF (
SELECTEDVALUE ( ‘BookmarkFlags'[Value] ) = 1,
[SelectedColour],
[DefaultTextColour]
)
Use the above template to create 9 more measures, 3 for each button and replacing SELECTEDVALUE ( ‘BookmarkFlags'[Value] ) = 1 with 2, 3,4 respectively for each button. With 12 measures created we are now ready to apply them to the buttons
Select the first button and apply conditional formatting to the button text colour for the three states – default, on hover, on press. Also apply conditional formatting on the fill colour. The following video shows which measure to use and how to do it.
Use the same process and apply conditional formatting for Buttons 2, 3, 4 by using the appropriate measures. The four bookmark buttons should look like the below with the default text applied.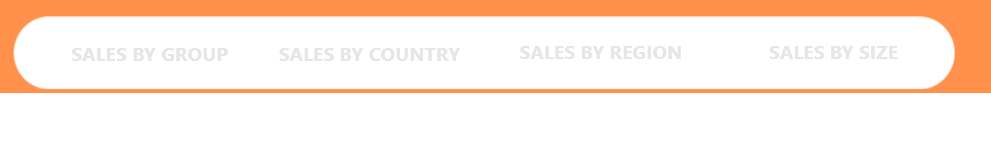
Open the bookmark pane and create four bookmarks and call them Bookmark 1, Bookmark 2, Bookmark 3, Bookmark 4.The final part involves updating the bookmarks by changing the value of the column Value from the BookmarkFlag table for each bookmark and updating the bar chart for each bookmark. We do this as below.
.
The final step is to assign each bookmark button its respective bookmark and then start browsing !