
Calculations groups are a collection of calculation items which are defined as base measures to easily calculate (mostly) time intelligence functions such as YTD, MTD, QTD without explicity writing such measures for each metric in the model. You can have multiple calculation groups in your model as well, though due precautions need to be taken. In this post we will see how to combine calculation groups, date interval table and disconnected table to produce powerful executive style dashboards.
Before we define calculated groups lets define some measures which we will use later
Total Sales = SUM ( FactSales[SalesAmount] )
Total Order Quantity = SUM ( FactSales[OrderQuantity] )
Total Tax Amount = SUM ( FactSales[TaxAmt] )
0_CurrentYear = YEAR ( NOW () + 10 / 24 )
We can define calculated groups using Tabular Editor (TE). In our favourite model we connect to TE and define a new calculated group called TimeIntelligence and define three calculation items YTD, QTD, MTD as follows
YTD:
CALCULATE ( SELECTEDMEASURE (), DATESYTD ( ‘DimCalendar'[DateID] ) )
QTD:
CALCULATE ( SELECTEDMEASURE (), DATESQTD ( ‘DimCalendar'[DateID] ) )
MTD:
CALCULATE ( SELECTEDMEASURE (), DATESMTD ( ‘DimCalendar'[DateID] ) )
We rename the column from Name to TimeCalculation and save the model.
We want to visualise the data now. In a blank report we create a line chart with DateID in the X axis and [Total Sales] under values. We then create a slicer with TimeCalculaion as the Field. The report looks like this when we start changing values in the slicer.
Not what we had in mind. What’s happening is when we choose YTD from the slicer we get the YTD lines for all the four years in the model (2018,2019,2020,2021) and similarly when choose QTD and MTD we get the respective “To Date” values for each quarter and month in the model. What we actually need is to give us a report giving YTD, QTD, MTD values for the current period. What we also want in another chart is to give us the yearly, quaterly, monthly values when we choose the appropriate values in the slicers. We achieve this by creating a DateInterval table. There are many ways to achieve this and one way is to run a SQL script like this. I’m running this on an Azure instance.
DECLARE
@CurrentDate DATE = CAST(SYSDATETIMEOFFSET() AT TIME ZONE ‘AUS Eastern Standard Time’ AS DATE)
DECLARE
@StartYearDate DATE = DATEADD(yy, DATEDIFF(yy, 0, @CurrentDate), 0)
,@EndYearDate DATE = DATEADD(yy, DATEDIFF(yy, 0, @CurrentDate) + 1, – 1)
,@StartMonthDate DATE = DATEADD(month, DATEDIFF(month, 0, @CurrentDate), 0)
,@EndMonthDate DATE = EOMONTH(@CurrentDate)
,@StartQuarterDate DATE = DATEADD(qq, DATEDIFF(qq, 0, @CurrentDate), 0)
,@EndQuarterDate DATE = DATEADD(qq, DATEDIFF(qq, 0, @CurrentDate) + 1, 0) – 1
,@PreviousYearStartDate DATE = DATEADD(yy, DATEDIFF(yy, 0, @CurrentDate) – 1, 0)
,@PreviousYearEndDate DATE = DATEADD(yy, DATEDIFF(yy, 0, @CurrentDate), – 1)
,@StartPreviousMonth DATE = DATEADD(month, DATEDIFF(month, 32, @CurrentDate), 0)
,@EndPreviousMonth DATE = DATEADD(month, DATEDIFF(month, 0, @CurrentDate), 0) – 1
,@Start14DaysPrevious DATE = DATEADD(day, DATEDIFF(day, 0, @CurrentDate), 0) – 14
,@End14DaysPrevious DATE = DATEADD(day, DATEDIFF(day, 0, @CurrentDate), 0) – 1
,@PreviousYearStartQuarterDate DATE = DATEADD(YEAR,–1, DATEADD(qq, DATEDIFF(qq, 0, @CurrentDate), 0))
,@PreviousYearStartMonthDate DATE = DATEADD(YEAR,–1, DATEADD(month, DATEDIFF(month, 0, @CurrentDate), 0))
DECLARE
@PreviousYearEndQuarterDate DATE = DATEADD(qq, DATEDIFF(qq, 0, @PreviousYearStartQuarterDate) + 1, 0) – 1
,@PreviousYearEndMonthDate DATE = EOMONTH(@PreviousYearStartMonthDate) ;
SELECT TOP (DATEDIFF(DAY, @StartYearDate, @EndYearDate) + 1) Dates = DATEADD(DAY, ROW_NUMBER() OVER (
ORDER BY a.object_id
) – 1, @StartYearDate)
,‘YTD’ AS [DateIntervalSelection]
,1 AS [DateIntervalSelectionOrder]
FROM sys.all_objects a
UNION
SELECT TOP (DATEDIFF(DAY, @PreviousYearStartDate, @PreviousYearEndDate) + 1) Dates = DATEADD(DAY, ROW_NUMBER() OVER (
ORDER BY a.object_id
) – 1, @PreviousYearStartDate)
,‘YTD’ AS [DateIntervalSelection]
,1 AS [DateIntervalSelectionOrder]
FROM sys.all_objects a
UNION
SELECT TOP (DATEDIFF(DAY, @StartQuarterDate, @EndQuarterDate) + 1) Dates = DATEADD(DAY, ROW_NUMBER() OVER (
ORDER BY a.object_id
) – 1, @StartQuarterDate)
,‘QTD’ AS [DateIntervalSelection]
,2 AS [DateIntervalSelectionOrder]
FROM sys.all_objects a
UNION
SELECT TOP (DATEDIFF(DAY, @PreviousYearStartQuarterDate, @PreviousYearEndQuarterDate) + 1) Dates = DATEADD(DAY, ROW_NUMBER() OVER (
ORDER BY a.object_id
) – 1, @PreviousYearStartQuarterDate)
,‘QTD’ AS [DateIntervalSelection]
,2 AS [DateIntervalSelectionOrder]
FROM sys.all_objects a
UNION
SELECT TOP (DATEDIFF(DAY, @StartPreviousMonth, @EndPreviousMonth) + 1) Dates = DATEADD(DAY, ROW_NUMBER() OVER (
ORDER BY a.object_id
) – 1, @StartPreviousMonth)
,‘Last Month’ AS [DateIntervalSelection]
,3 AS [DateIntervalSelectionOrder]
FROM sys.all_objects a
UNION
SELECT TOP (DATEDIFF(DAY, @StartMonthDate, @EndMonthDate) + 1) Dates = DATEADD(DAY, ROW_NUMBER() OVER (
ORDER BY a.object_id
) – 1, @StartMonthDate)
,‘MTD’ AS [DateIntervalSelection]
,4 AS [DateIntervalSelectionOrder]
FROM sys.all_objects a
UNION
SELECT TOP (DATEDIFF(DAY, @PreviousYearStartMonthDate, @PreviousYearEndMonthDate) + 1) Dates = DATEADD(DAY, ROW_NUMBER() OVER (
ORDER BY a.object_id
) – 1, @PreviousYearStartMonthDate)
,‘MTD’ AS [DateIntervalSelection]
,4 AS [DateIntervalSelectionOrder]
FROM sys.all_objects a
UNION
SELECT TOP (DATEDIFF(DAY, @Start14DaysPrevious, @End14DaysPrevious) + 1) Dates = DATEADD(DAY, ROW_NUMBER() OVER (
ORDER BY a.object_id
) – 1, @Start14DaysPrevious)
,‘Last 14 Days’ AS [DateIntervalSelection]
,5 AS [DateIntervalSelectionOrder]
FROM sys.all_objects a
What this produces is a DateInterval table with three columns – DateIntervalSelection, DateIntervalSelectionOrder and Dates . A sample preview is shown below for MTD, QTD, and YTD
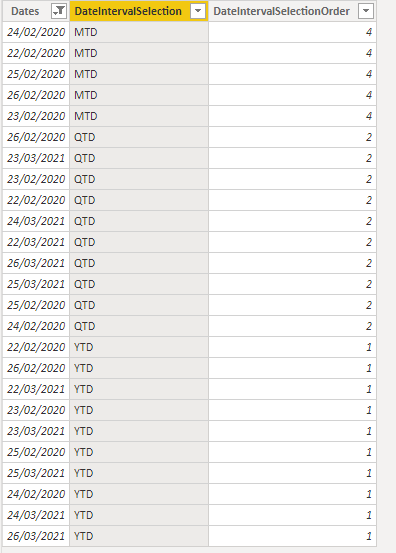
A couple of things to note here: Say for YTD you will notice that for every day in 2021 there is a corresponding day in 2020. This is the case for QTD and MTD as well. This is necessary as will be plotting YTD and YTD Previous Year in the same chart and we need to have dates for both the calculation items in the DateInteval table.This will make more sense when we define these calculation items below
Add three more calculation items to the TimeIntelligence calculation group YTD PY, QTD PY, MTD PY. These are the items for the “To Date” values for the previous year. We also need to make changes to YTD, QTD, and MTD
MTD PY:
IF (
SELECTEDVALUE ( DateInterval[DateIntervalSelection] ) = “MTD”,
TOTALYTD ( SELECTEDMEASURE (), DATEADD ( DimCalendar[DateID], -12, MONTH ) )
)
MTD:
VAR _CurrentYear = [0_CurrentYear]
RETURN
IF (
SELECTEDVALUE ( DateInterval[DateIntervalSelection] ) = “MTD”,
CALCULATE (
SELECTEDMEASURE (),
DATESMTD ( ‘DimCalendar'[DateID] ),
‘DimCalendar'[CalendarYear] = _CurrentYear
)
)
QTD PY:
IF (
SELECTEDVALUE ( DateInterval[DateIntervalSelection] ) = “QTD”,
TOTALYTD ( SELECTEDMEASURE (), DATEADD ( DimCalendar[DateID], -4, QUARTER ) )
)
QTD:
VAR _CurrentYear = [0_CurrentYear]
RETURN
IF (
SELECTEDVALUE ( DateInterval[DateIntervalSelection] ) = “QTD”,
CALCULATE (
SELECTEDMEASURE (),
DATESQTD ( ‘DimCalendar'[DateID] ),
‘DimCalendar'[CalendarYear] = _CurrentYear
)
)
YTD PY:
VAR _CurrentYear = [0_CurrentYear]
RETURN
IF (
SELECTEDVALUE ( DateInterval[DateIntervalSelection] ) = “YTD”
|| NOT ( ISFILTERED ( DateInterval[DateIntervalSelection] ) ),
CALCULATE (
TOTALYTD ( SELECTEDMEASURE (), DATEADD ( ‘DimCalendar'[DateID], -1, YEAR ) ),
‘DimCalendar'[CalendarYear] = _CurrentYear
)
)
YTD:
VAR _CurrentYear = [0_CurrentYear]
RETURN
IF (
SELECTEDVALUE ( DateInterval[DateIntervalSelection] ) = “YTD”
|| NOT ( ISFILTERED ( DateInterval[DateIntervalSelection] ) ),
CALCULATE (
SELECTEDMEASURE (),
DATESYTD ( ‘DimCalendar'[DateID] ),
‘DimCalendar'[CalendarYear] = _CurrentYear
)
)
We can now start to visualise the data. The following video will give the details
The dashboard is already looking good. Now what if we wanted to visualise YTD, MTD, QTD etc for other metrics ? This is easier to do. We define another calculation group called KPI and define these calculation items as
Sales: [Total Sales]
Quantity: [Total Order Quantity]
Sales : [Total Sales]
We save the model and place another slicer on the report and drag the KPI column into that slicer. The report now looks like this
You will notice that though the report works fine, the titles are not updated when you change the metrics. This can be overcome by defining a disconnected table instead of using a calculated group. We define a disconnected table as below and call it MetricTable
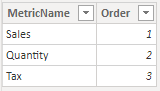
We also need to update the metric slicer with values from the MetricName column from this table. We then define a measure which calls the appropriate measure when we select a metric name from the slicer
Metric =
VAR a =
SELECTEDVALUE ( MetricTable[MetricName] )
RETURN
SWITCH (
a,
“Sales”, [Total Sales],
“Quantity”, [Total Order Quantity],
“Tax”, [Total Tax Amount]
)
We also define three more measures for the titles for the three charts.
Title Daily Values =
VAR a =
SELECTEDVALUE ( DateInterval[DateIntervalSelection] )
RETURN
SWITCH (
a,
“YTD”,
SELECTEDVALUE ( MetricTable[MetricName] ) & ” – “ & “This Year”,
“QTD”,
SELECTEDVALUE ( MetricTable[MetricName] ) & ” – “ & “This Quarter”,
“MTD”,
SELECTEDVALUE ( MetricTable[MetricName] ) & ” – “ & “This Month”,
SELECTEDVALUE ( MetricTable[MetricName] ) & ” – “
& SELECTEDVALUE ( DateInterval[DateIntervalSelection] )
)
Title Date Interval =
VAR a =
SELECTEDVALUE ( DateInterval[DateIntervalSelection] )
RETURN
IF (
a IN { “YTD”, “QTD”, “MTD” },
SELECTEDVALUE ( MetricTable[MetricName] ) & ” – “
& SELECTEDVALUE ( DateInterval[DateIntervalSelection] ),
“”
)
Title Top Product =
VAR a =
SELECTEDVALUE ( DateInterval[DateIntervalSelection] )
RETURN
SWITCH (
a,
“YTD”, SELECTEDVALUE ( MetricTable[MetricName] ) & ” – This Year: TOP 20 Products”,
“QTD”, SELECTEDVALUE ( MetricTable[MetricName] ) & ” – This Quarter: TOP 20 Products”,
“MTD”, SELECTEDVALUE ( MetricTable[MetricName] ) & ” – This Month: TOP 20 Products”,
SELECTEDVALUE ( MetricTable[MetricName] ) & ” – “
& SELECTEDVALUE ( DateInterval[DateIntervalSelection] ) & “: TOP 20 Products”
)
Finally we conditionally format the titles of the charts and update the Values field in the chart to the measure [Metric] to produce the following report
You can download the PBIX file by clicking the link below