
You say the hill’s too steep to climb
Chiding!
You say you’d like to see me try
Climbing!
You pick the place and I’ll choose the time
And I’ll climb
The hill in my own way
~ Fearless/Pink Floyd
When I started learning Power BI in 2016 it changed my life. I was then working as a consultant in the mining industry and my primary tool for data analysis and visualisation was MS Excel. I was very good at it but always felt it could be better and more powerful. So, Power BI with its relational data model, interactive visuals, and online sharing and collaboration was like a godsend. I quickly embraced it and started my own consultancy and now provide analytical and reporting solutions using Power BI as my main tool of choice.
The path to learning Power BI was ad hoc at first. Almost all of my learning came from enrolling in free online courses, watching videos on YouTube, blogs, articles, and the Power BI community. A lot of times I learned on the job (best way to learn), which further cemented the concepts. Later, I bought a couple of books to acquaint myself with advance topics. Over the last year and a half, I have amassed a lot of knowledge and expertise and thought I should share some of my experiences to give something back to the community.
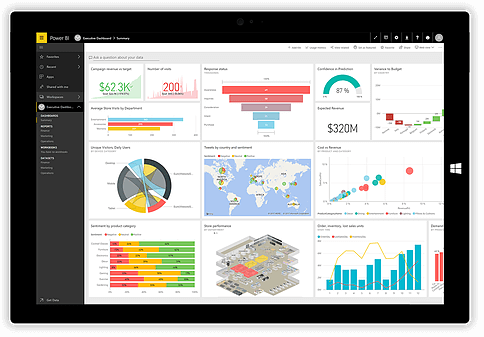
So, to begin with what is Power BI? From Microsoft’s own words “Power BI is a suite of business analytics tools to analyze data and share insights”. Power BI lets you create interactive and powerful reports and dashboards by connecting to more than 100 different data sources from Excel, Relational Databases and even from web pages. Getting insights from your data is a one click process using Power BI. Unlike Excel you can upload your reports online to Power BI service to facilitate sharing and collaboration. Power BI can essentially replace Excel as the primary tool for analysing and visualising data. It is FREE to download and use.
Now that I have piqued your interest I will outline detailed steps to follow in order to make your learning easier. I recommend that you complete steps 1 and 2 in the given order. The rest of the steps is on going learning and very much depends on your interest and enthusiasm
1. Before you delve into Power BI, you need to know about key concepts related to database and relational modelling. Follow this link and go through the course thoroughly to get acquainted with relational modelling. – 4 weeks
https://channel9.msdn.com/Series/dbfundamentals/01
2. The heart of Power BI is the data model from which all analysis and visualisation is conducted. It is essentially a dimensional data model. So if you are not familiar with it go through this pdf to learn more – 4 weeks
3. Once you are familiar with dimensional modelling enrol for this FREE Power BI course on Edx to give you an introduction to the topic. By the end of the course you would have learned how to import and manipulate your data, build the data model, analyse and visualise it and upload to the service for sharing and collaboration – 4 weeks
https://www.edx.org/course/analyzing-visualizing-data-power-bi-microsoft-dat207x-8
4. Practice, practice, and practice. This is a very important step. You will not become an expert just by finishing the above course. You can use your work-related data (relational or flat file) or if you don’t have relevant data at work use the data from www.abs.gov . If you are using flat files as your data source you will have to manipulate the data first before designing a data model. You will be using the Query Editor (also known as Power Query) module in Power BI for this. For a detailed look into this module check out these videos – ongoing
Power Query Formula Language – https://www.youtube.com/watch?v=IdwmH-6ED60
Microsoft Power Query 101 – https://www.youtube.com/watch?v=IvK_my-Xj9k
Deep Dive into Power Query Formula Language – https://www.youtube.com/watch?v=KXxUDWwo0pg
5. Register for the Power BI community online and take part in the Power BI forums and ask questions – ongoing
You can also suggest ideas for improvements in Power BI at
https://ideas.powerbi.com/forums/265200-power-bi?WT.mc_id=Community
6. At some point in time you will start using DAX (Data Analysis Expressions) to perform calculations on your data. DAX is a powerful formula language to query your data. It is the language with which you interact with your data. The best way to learn DAX is to buy a book and practise the exercises from the book. I highly recommend “Learn to write DAX” by Matt Allington. If you are an Excel user you will find the book very useful as you can easily transition into DAX from Excel by reading this book – 4 weeks
There are many more out there. If you know someone who is a Power BI guru please mention them in the comments so that other people can follow them and learn from the best.
So there it is, I have outlined the steps you need to follow in order to become a Power BI Superstar in your company. You only need to spend 4 hours a week on these topics and by the end of the year you will be on your way to gathering insights from data in ways you could not do earlier.