
You cannot password protect a Power BI report natively. However there are some hacks which you can use which simulates password protection. However these can easily be “unhacked” so please do not use these techniques on client sensitive data. This is more of an academic exercise and hence worth writing about. There could be other use cases for these techniques
- Enter password into a keyboard in Power BI
In this technique we will simulate a keyboard environment in Power BI and ask the user to enter the password via the keyboard.
- In a blank Power BI file import three tables which correspond to the three rows of a typical keyboard as follows
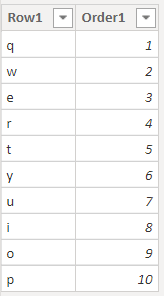
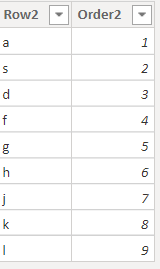
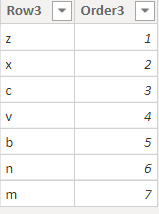
- Order Row1 by Order1 , Row2 by Order2 , and Row3 by Order3
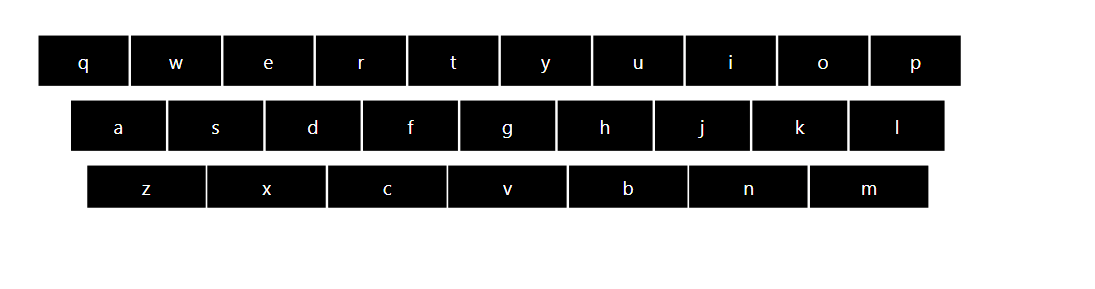
- Drag Row1, Row2, and Row3 into three slicers and apply formatting so that they look like this in the canvas
- Our password will have four characters. Define four measures for each of them as follows
first letter =
VAR KB1 =
IF ( ISFILTERED ( Row1[Row1] ), COUNTROWS ( FILTERS ( Row1[Row1] ) ), 0 )
VAR KB1Value =
LOOKUPVALUE (
Row1[Row1],
Row1[Order1], LASTNONBLANK ( TOPN ( 1, VALUES ( Row1[Order1] ) ), 1 )
)
RETURN
IF ( KB1 > 0, KB1Value, “” )
second letter =
VAR KB2 =
IF ( ISFILTERED ( Row1[Row1] ), COUNTROWS ( VALUES ( Row1[Row1] ) ), 0 )
VAR KB2Value =
IF (
COUNTROWS ( VALUES ( Row1[Row1] ) ) < 2,
“”,
LOOKUPVALUE (
Row1[Row1],
Row1[Order1], LASTNONBLANK ( TOPN ( 2, VALUES ( Row1[Order1] ) ), 1 )
)
)
RETURN
IF ( KB2 > 0, KB2Value, “” )
third letter =
VAR KB3 =
IF ( ISFILTERED ( Row3[Row3] ), COUNTROWS ( VALUES ( Row3[Row3] ) ), 0 )
VAR KB3Value =
LOOKUPVALUE (
Row3[Row3],
Row3[Order3], LASTNONBLANK ( TOPN ( 1, VALUES ( Row3[Order3] ) ), 1 )
)
RETURN
IF ( KB3 > 0, KB3Value, “” )
fourth letter =
VAR KB4 =
IF ( ISFILTERED ( Row2[Row2] ), COUNTROWS ( FILTERS ( Row2[Row2] ) ), 0 )
VAR KB4Value =
LOOKUPVALUE (
Row2[Row2],
Row2[Order2], LASTNONBLANK ( TOPN ( 1, VALUES ( Row2[Order2] ) ), 1 )
)
RETURN
IF ( KB4 > 0, KB4Value, “” )
- Now I know the password and hence I deliberately kept the DAX simple, it gets complicated when you want to capture the characters by entering any letters on the keyboard. I will leave it to the readers to attempt it
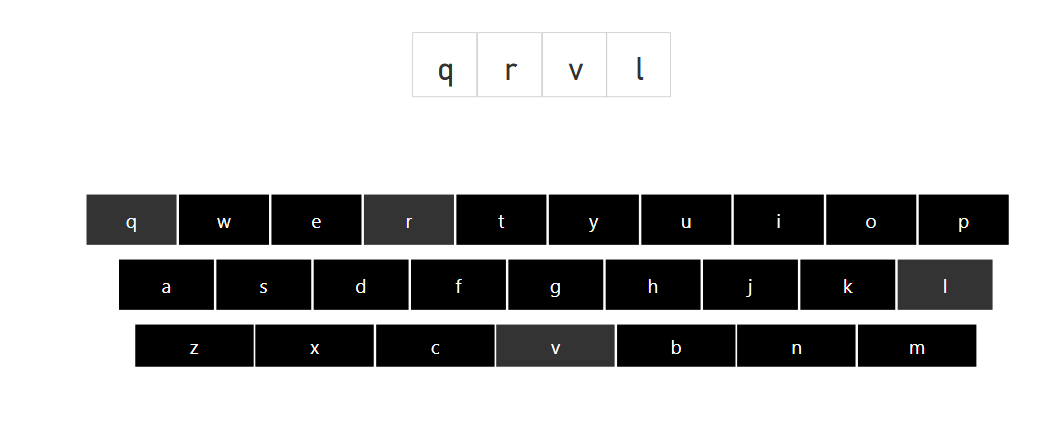
- Place four card visuals on the top of the key board and place one measure on each of them and click the characters “q”, “r”, “v”, “l” in the keyboard. It should look like this
- Now we need another measure to check if the password entered is correct
Password =
IF (
[1_first letter] & [2_second letter_New] & [3_third letter] & [4_fourth letter] = “qrvl”,
1,
0
)
- Create a new table by entering data and create a column Index and give it a value 1 (you can pick any name and value)
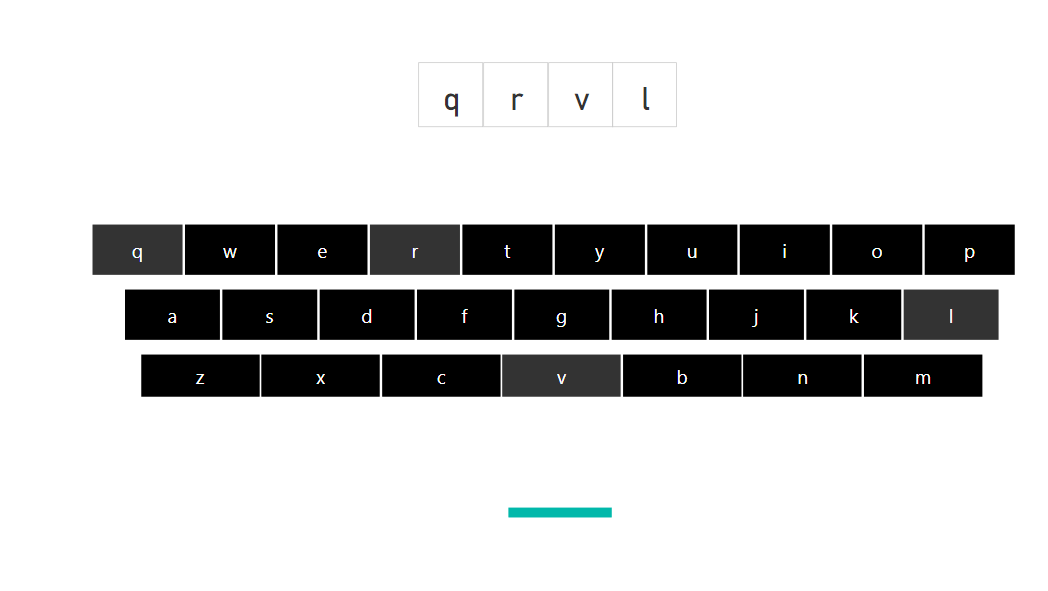
- Place a stacked bar chart visual into the canvas below the keyboard and drag Index into the Axis field and the measure Password into the Value field. Under the format pane of the visual disable x axis, y axis, title, tooltip, and visual header. Format it to the correct size so that the whole canvas now looks like this
- Create a new page and make it hidden. Drag the Index column into the field “Add drillthrough field here” and under Allow drillthrough when: choose Used as a category. This is the main page which the users will see when they enter the password and drillthrough from the first page. So you have to make sure its hidden for this to work
- Now you can go back to the first page and right click on the bar chart and drillthrough to the second page
Report here
2. Enter the password into a search bar
In this technique the user has to enter the password into a search bar. However, because the measure used is ISFILTERED you only need to guess one of the characters of the password and you can “unhack” it. Plus even if you enter the correct password correctly anybody can retrieve it from the web pages’ memory in the browser. So once again, do not use this method on any client data, its just an academic exercise
- Create a new table called Password with two columns columns Index and Password. Give a value of 1 for Index and let the password be &)_+:\ (you can pick any value for password and Index)
- Define a measure:
Password =
IF ( ISFILTERED ( Password[Password] ), 1, 0 )
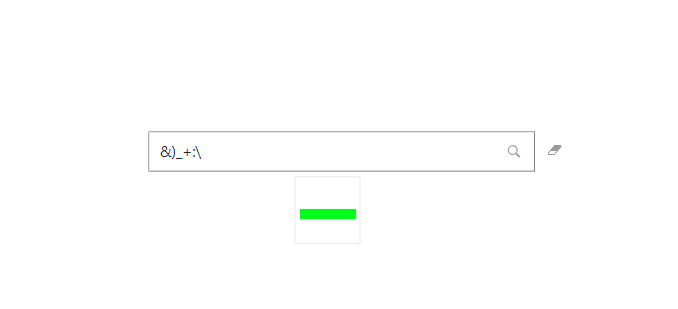
- Drag the Text filter visual into the canvas and drag the password column into it and enter the password &)_+:\ and press ENTER
- Place a stacked bar chart visual into the canvas below the Text filter visual and drag Index into the Axis field and the measure Password into the Value field. Under the format pane of the visual disable x axis, y axis, title, tooltip, and visual header. Format it to the correct size so that the whole canvas now looks like this
- Create a new page and make it hidden. Drag the Index column into the field “Add drillthrough field here” and under Allow drillthrough when: choose Used as a category. This is the main page which the users will see when they enter the password and drillthrough from the first page. So you have to make sure its hidden for this to work
- Now you can go back to the first page and right click on the bar chart and drillthrough to the second page
Report here